

Predicting the London Olympics Medal Count
and the Why’s Behind It
By Dan Graettinger
Will the United States retain its position as the top medal-winning nation at this year’s Olympic Games in London, or will up-and-coming China capture the crown? Is it possible to predict how many medals each nation will win? Why do some countries take home a bundle of medals while others take home none at all? And what is it about a nation that allows it to produce Olympic medal-winning athletes?
It was these latter two questions that intrigued me the most. If we look at the medal counts for the two most recent Olympic Games (see Table 1), we see that the top two nations are the U.S. and China, who happen to be the 3rd and 1st most populous nations in the world. So population seems to be important. But where is India, the world’s second most populous nation?[f1] Maybe wealth is the key factor. That seems to fit. A lot of the nations at the top of the list are the wealthier nations of the world. But how did Cuba and Belarus rank so high? As we think more and more about it, it quickly becomes clear that the why’s behind the medal counts at the Olympics are complex. Fortunately, I’m a data miner, and my job is to find patterns in data and use those patterns to predict future events. And trying to predict the 2012 Olympic medal counts using data mining methods was too tempting to pass up!
Since the puzzle I wanted to solve focused on the characteristics of nations that lead to their success at the Olympics, I took a top-down approach -- looking purely at national measures. However, there are other ways to project the medal counts. A bottom-up approach would look at the top athletes in each event, assess their recent results, and assign individual odds of winning a medal. Then you can sum those individual odds across all 29 sports to get national totals.[f2] Since the nation-focused perspective would give us more explanatory power and insight into the “why” questions that captured our imagination, we chose that approach.
To project the medal counts using the top-down method, I first needed to compile data on the nations of the world that might shed some light on what makes a difference in the medal count. On the one hand, I wanted to collect data that my intuition said was important, like population, wealth, and development level. On the other hand, I wanted to hold the door open for other categories of data that could have an impact, like geography, history, religion, political organization, and personal freedoms. By linking each nation’s data with its Olympic outcomes, perhaps patterns would emerge that would allow for a mathematical model to be created that would be predictive, while simultaneously giving insights that would answer my questions. (See Table 2 at the end of this article for the full list of variables and their sources that went into the dataset.)
For statistical reasons, we decided to try to predict which nations would win two or more medals. This would help eliminate some statistical “noise” in the data where a nation might win a medal due to a single outstanding individual. After that, we compared each of the variables against the outcome of winning two or more medals. This allowed us to find those characteristics of a nation that do and do not connect strongly with their medal count. So let’s take a look at some of the expected, the sensible, and the downright head-scratching characteristics of a nation that relate to its ability to produce world champion athletes.
What Does Matter
- The single characteristic most closely associated with winning Olympic medals is … Number of Internet Users. My initial reaction was, “What the heck??!!” This is a good time to point out that good predictors may not actually cause the outcome, but rather go together with (correlate to) the outcome.[f3] After further thought, I realized that the number of internet users does tell us a lot about a country. The people are wealthy enough to afford computers and internet access. The population of the country is relatively large (since this piece of data measured the total number of users, not users per capita). Finally, the people have enough free time on their hands to engage in non-subsistence-related activities, like participating in sports or surfing the net!
- Total Gross Domestic Product - Here again we see an indication that a nation’s wealth helps them to produce elite athletes. What’s intriguing, though, is that the total GDP for the nation was far more predictive than GDP per capita. For example, in 2008, China had the second highest national GDP in the world, as well as the second most medals at the Olympics. Yet China's GDP per capita ranked them 134th in the world, behind nations like Thailand, Tunisia, and El Salvador. One possible explanation is that China’s communist government, having access to the great combined wealth of the nation, diverted enough funds to their government-sponsored athlete development program to overwhelm the relative poverty of that nation’s individuals.
- Total Population - Now that makes sense! With all else being equal, the more individuals a nation has, the more outstanding individuals there ought to be. This is why high school athletics in the United States are divided by the size of the school. A high school with 2,000 students will likely have more high-caliber athletes than a high school with only 200 students.
- Latitude - Here’s another entry in the “What the heck??” category. The only reason I included this piece of data in the dataset was
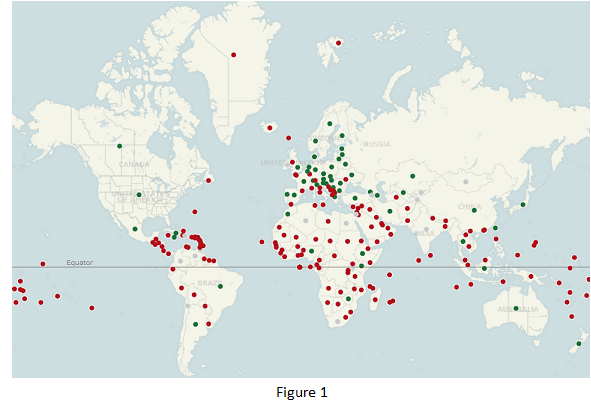 that I originally envisioned this project after watching the 2010 Winter Olympics. I had a hunch -- and I’m going way out on a limb here! -- that nations further from the equator just might perform better at snow-related sports than countries like Western Sahara and Malaysia. Yet latitude also showed up as a significant predictor of Summer Olympics medals! Here’s the map (Figure 1), with green dots indicating nations that won two or more medals in both 2004 and 2008[f4], grey dots indicating winning two or more only one of those times, and red dots indicating no medals at either Olympiad.
 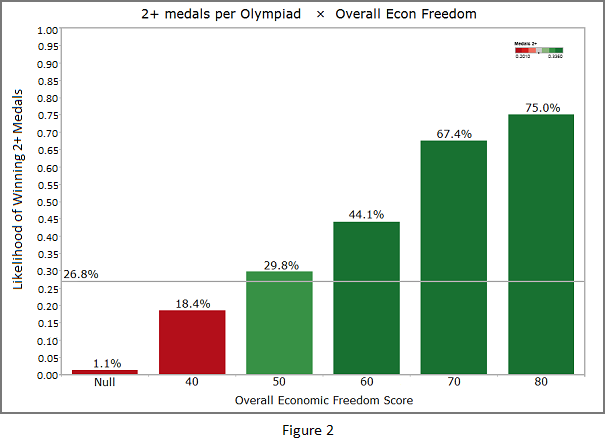 Overall Economic Freedom - Each year the Heritage Foundation publishes a chart ranking nations on various aspects of freedom. The higher the scores, the greater the freedom the people enjoy. As Figure 2 indicates, the higher the economic freedom score, the more likely a nation was to win two or more medals in the last two Games. Nations whose freedom scores measured in the 80’s had a 75% likelihood of winning medals in 2004 and 2008. So freedom is a factor.
Enough Wonkiness - How Did the Predictions Turn Out?
Considering that we took a top-down approach and used only high-level, national statistics as predictors, the results turned out pretty well. When we tested the predictive model against the actual ‘04 and ‘08 medal counts, we got the scatter plot diagram in Figure 3.
If the model had been able to predict perfectly, all of the dots would have fallen directly on the diagonal line. As you can see, the results do generally follow the line, so that tells us that our model really is on to something. Another thing we immediately notice is that a number of nations stand out as overperforming and underperforming against the model. Perhaps the most important reasons for this are …
- The make-up of a nation isn't the whole story. The drive and determination of individual athletes are things that can’t be seen from 30,000 feet.
- There are factors that influence the winning of medals for which data was not available.
This second point still tantalizes me. If only I could’ve gotten some data on the extent to which each country subsidizes its athletes. Would that explain Cuba’s overperforming in 2004 and 2008? And how can you measure a nation’s affinity for sports? Whether it’s table tennis in China or gymnastics in Russia and Romania, a nation’s love of a specific sport (or of sports in general) is something we can’t factor in for now. Finally, how are those small, impoverished nations like Jamaica, Kenya, and Ethiopia able to consistently produce winners in track and field? I guess we’ll just have to watch the broadcasts and see if we can find out!
See more Discovery Corps Articles
About the author: Dan Graettinger is a data mining consultant currently working with Discovery Corps, Inc., a Pittsburgh-area company specializing in data mining, visualization, and predictive analytics. Your comments and questions about this article are welcome. Please contact Dan at (815)-361-5045 or dgraettinger@discoverycorpsinc.com.
Thanks to God for the help in writing. I prayed and know that He answered.
__footnotes______________
1 India won one medal in Athens in 2004 and three medals in Beijing in 2008.
2 Both USA Today and the Wall Street Journal Online have written interesting articles and generated predictions from the bottom-up point of view.
3 For example, suppose you were trying to predict whether a person would be a fan of the Chicago Bears football team. I would imagine that, if you could get your hands on it, the piece of data most strongly correlated with “Chicago Bears fan” would be “Chicago Bulls fan.” Being a Bulls fan doesn’t cause a person to be a Bears fan. But being a Chicago Bulls fan encapsulates many of the same elements that would contribute to being a Bears fan: living in or near Chicago, liking sports, etc.
4 In Figure 2, you’ll see a benchmark line at 26.8%. That is the percentage of nations who participated in the 2004 & 2008 Games and won two or more medals.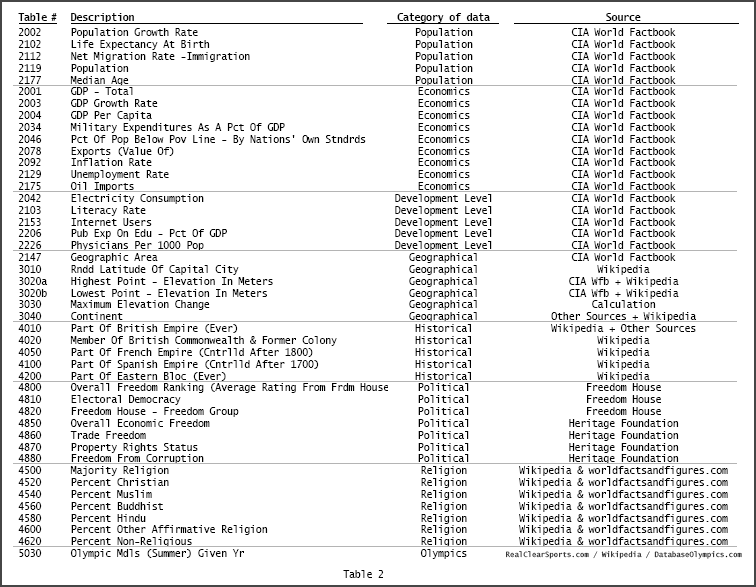
Copyright © 2012, Discovery Corps, Inc.