« Article - The Histogram | Main | SlideShare presentation on DM Machine Learning »
Monday
Apr302012

Article - Correlation & Scatter Plots

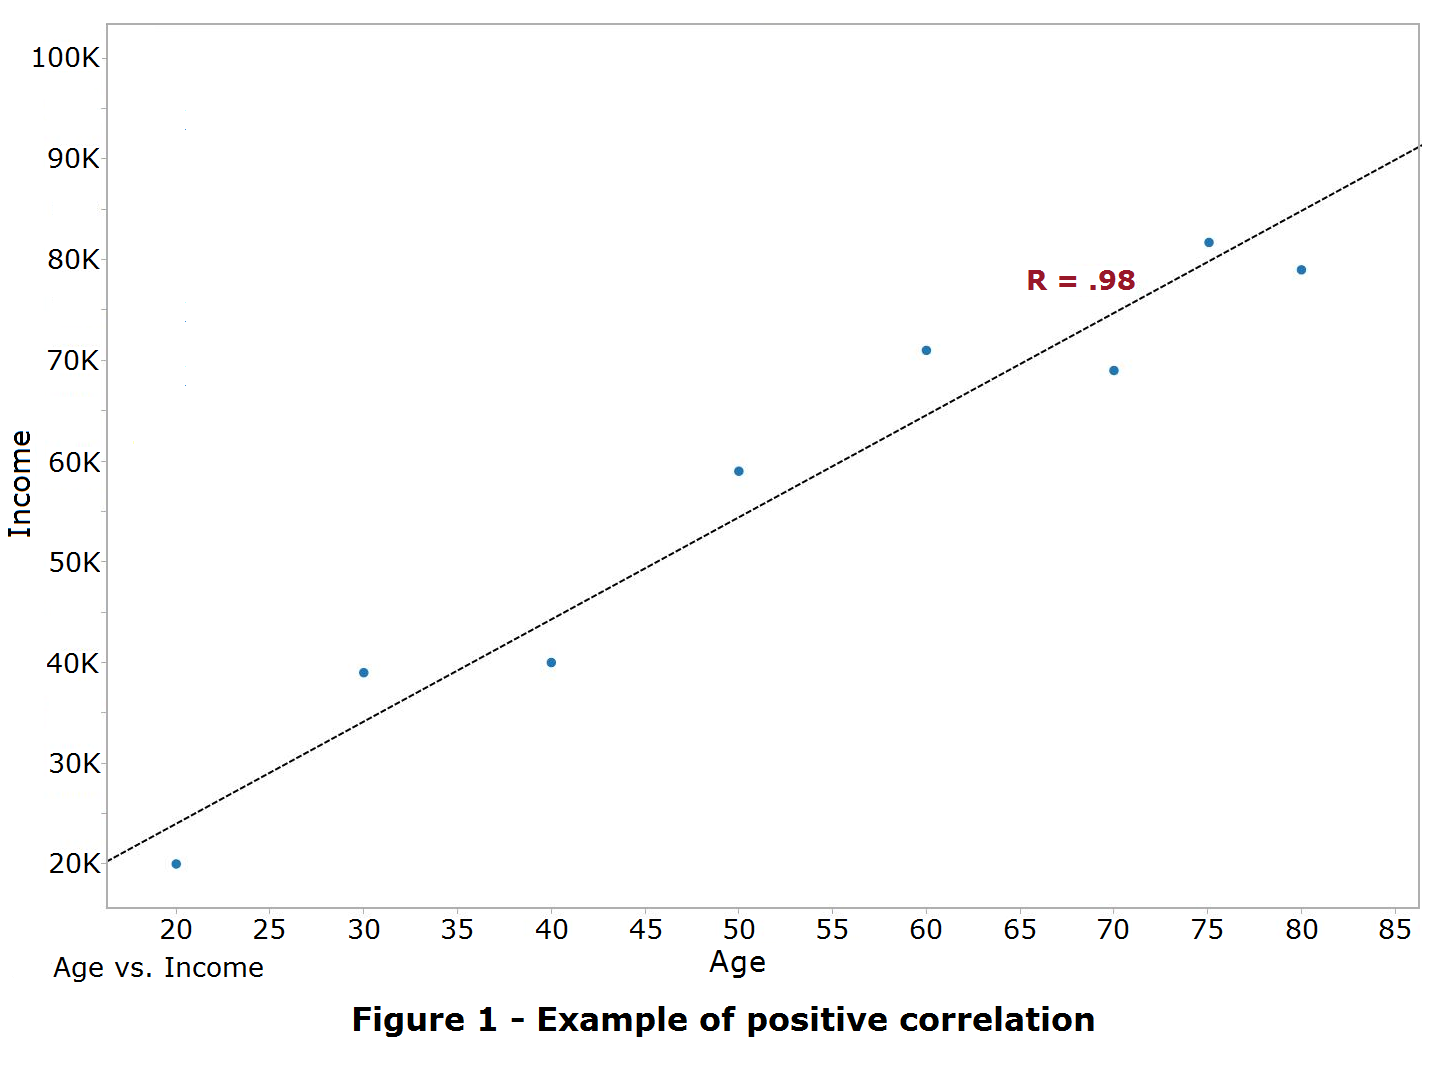
In this article, we review two, intertwined tools in the data mining arsenal: correlation and scatter plots.  These tools are fundamental for gauging the relationship (if any) between pairs of data elements (say, the age and income of your customers).  As we’ll soon see, there are good, bad, and ugly things that can happen when we apply a purely computational method like correlation.  My goal is to help you avoid the usual pitfalls, so  you can use correlation and scatter plots effectively in your own work.     Read the article

PrintView Printer Friendly Version

EmailEmail Article to Friend

References (7)

References allow you to track sources for this article, as well as articles that were written in response to this article.
  • Response
    Response: RajaPoker
    Discovery Corps Inc. - DCI News - Article - Correlation
  • Response
  • Response
  • Response
  • Response
  • Response
    Great insights on correlation and scatter plots—at Cooee, we simplify global connectivity with mobile numbers in 20+ countries for seamless calling and texting anywhere.
  • Response
    Response: Uniglofinancial
    A clear and practical take on using correlation and scatter plots—just as **Uniglo Financial** provides precise **Payroll, Accounting, and Compliance solutions** across the UK and EMEA region.

Reader Comments

There are no comments for this journal entry. To create a new comment, use the form below.

PostPost a New Comment

Enter your information below to add a new comment.

My response is on my own website »
Author Email (optional):
Author URL (optional):
Post:
 
Some HTML allowed: <a href="" title=""> <abbr title=""> <acronym title=""> <b> <blockquote cite=""> <code> <em> <i> <strike> <strong>